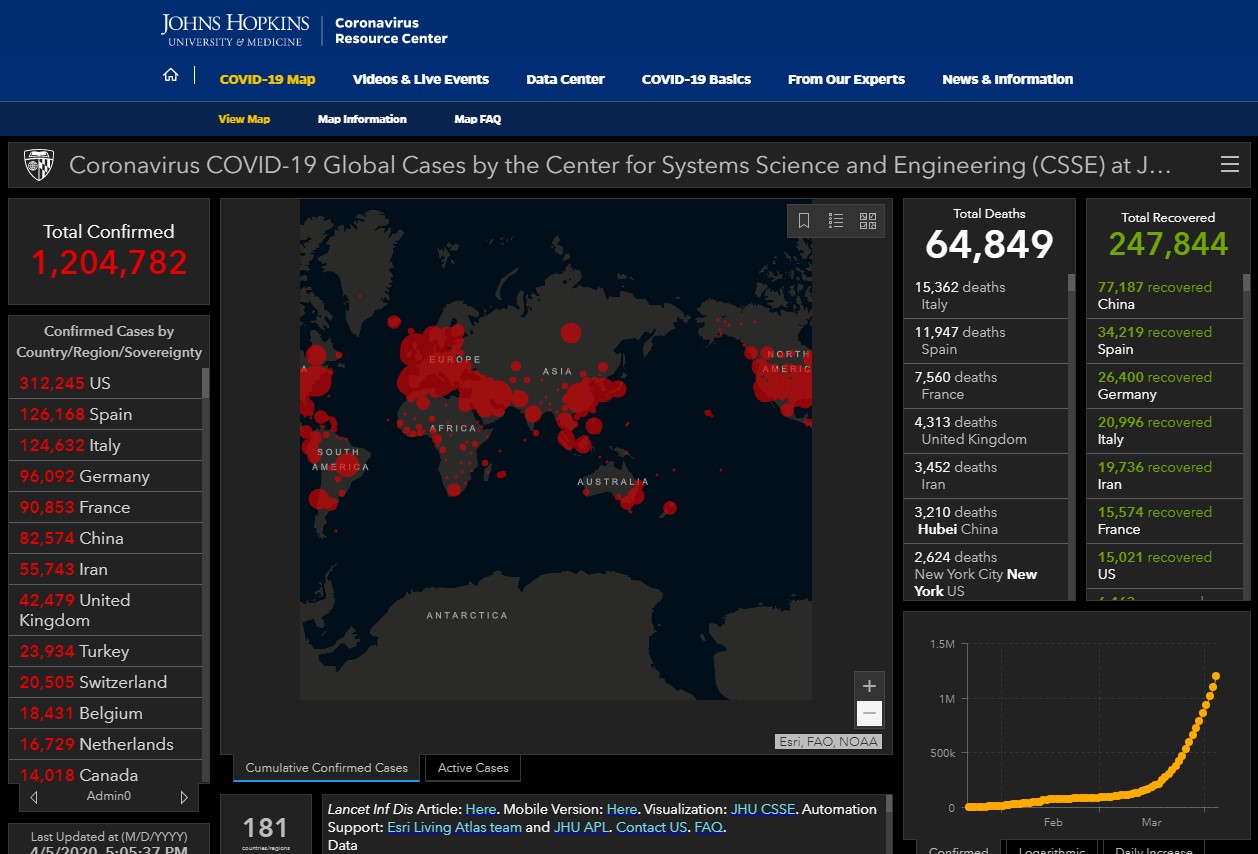
Global COVID-19 cases resource from John Hopkins
The Global COVID-19 map was first shared publicly on Jan. 22. It was developed to provide researchers, public health…
- COVID-19
- 1.6K
The Global COVID-19 map was first shared publicly on Jan. 22. It was developed to provide researchers, public health…
The Global COVID-19 map was first shared publicly on Jan. 22. It was developed to provide researchers, public health authorities, and the general public with a user-friendly tool to track the outbreak as it unfolds. All data collected and displayed are made freely available through a GitHub repository, along with the feature layers of the dashboard, which are now included in the ESRI Living Atlas. For a detailed explanation for the dashboard’s development, please refer to this article in The Lancet by Professor Lauren Gardner.
Internet is huge! Help us find great content
Never miss a thing! Sign up for our newsletter to stay updated.
Research Stash is a curated collection of tools and News for S.T.E.M researchers
Have any questions or want to partner with us? Reach us at [email protected]