
Massive Exercise Underway To Map Air Pollution Sources in the Indian Capital

Massive Exercise Underway To Map Air Pollution Sources in the Indian Capital

  • Research Stash
  • News
  • 2.4K

A group of scientists and students are braving heat and dust this summer in the national capital to map all possible sources of air pollution so that by winter this year we can get a fair idea of different sources of pollution in the city.

Subscribe to our YouTube Channel

Ground level data about emissions from as many as 26 different sources of pollution is being collected throughout the city, as part of a three-month campaign to prepare an emission inventory. The last such exercise was undertaken in 2010 just before the Commonwealth Games. Since then significant changes have occurred in land use and demography. Many new sources, which were earlier not taken seriously or ignored, will now be quantified.

While industry and transport sectors are apparent sources of air pollution, there are scores of other contributors to deteriorating air quality. Preparing a detailed emission inventory can give a clearer picture, instead of the ‘source apportionment’ approach.
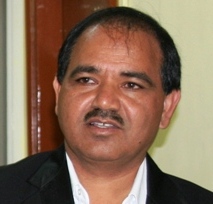
 Prof Gufran Beig

“Emission inventory is a scientific way to identify aggregated local source contribution and their region-specific spatial distribution within a confined boundary. It is a more effective tool to identify hot spots and plan control measures,” explained Prof Gufran Beig, Project Director, SAFAR at IITM, while speaking to India Science Wire. The emission inventory campaign has been mounted run by Indian Institute of Tropical Meteorology (IITM) Pune under the Ministry of Earth Sciences.
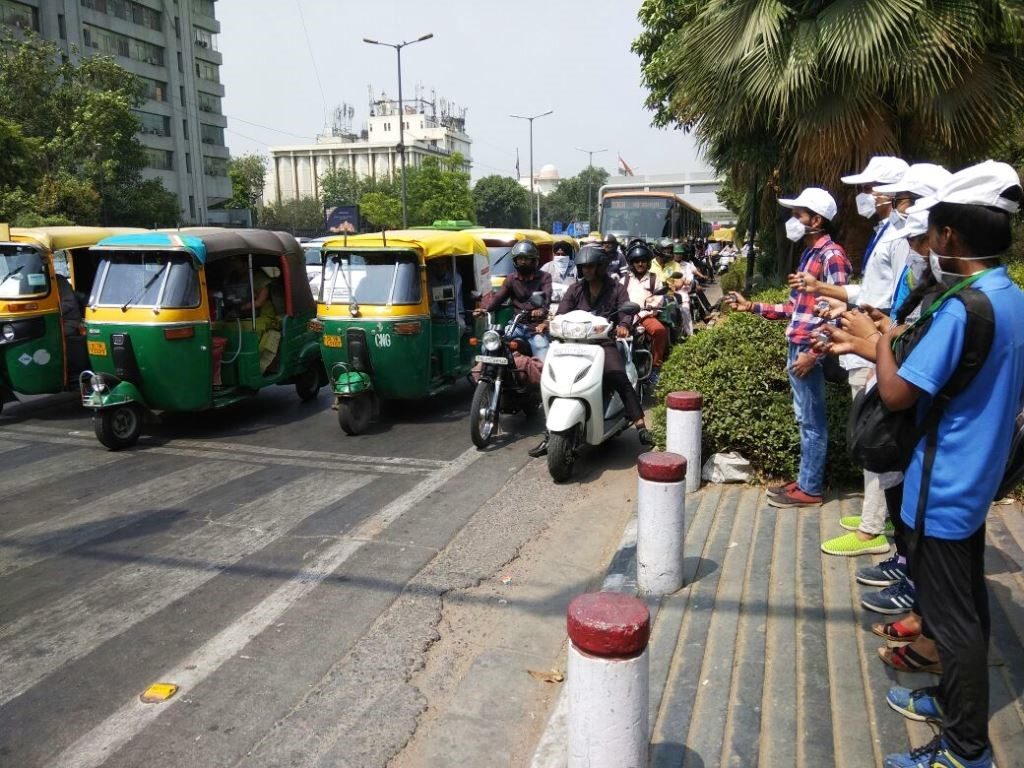
Air pollution data being collected in Delhi. IMAGE - IITM, Pune

The data being collected promises to be more accurate than what was collected in 2010 because it will include all possible sources of emissions – from crop burning to wood burning in crematoria – and also because of finer grids in which it is being collected. The city has been divided into grids measuring 400 meterX400 meter. In all, there are 12,000 such grids. Of them, data is being collected from 1000 grids.

In each of the grids, activities contributing to air pollution will be mapped. In each grid, pollution will be mapped in terms of sources such as slums, small-scale industries, road conditions, traffic congestion, vendors, population density, vehicle density, road conditions and potential of dust lifting based on paved and unpaved areas. The new sectors and factors, which are being targeted for mapping include the condition of roads, pattern of transport flow from surrounding regions, construction activity, aviation, practices of immigrant workers and changing lifestyles, cooking habit etc.
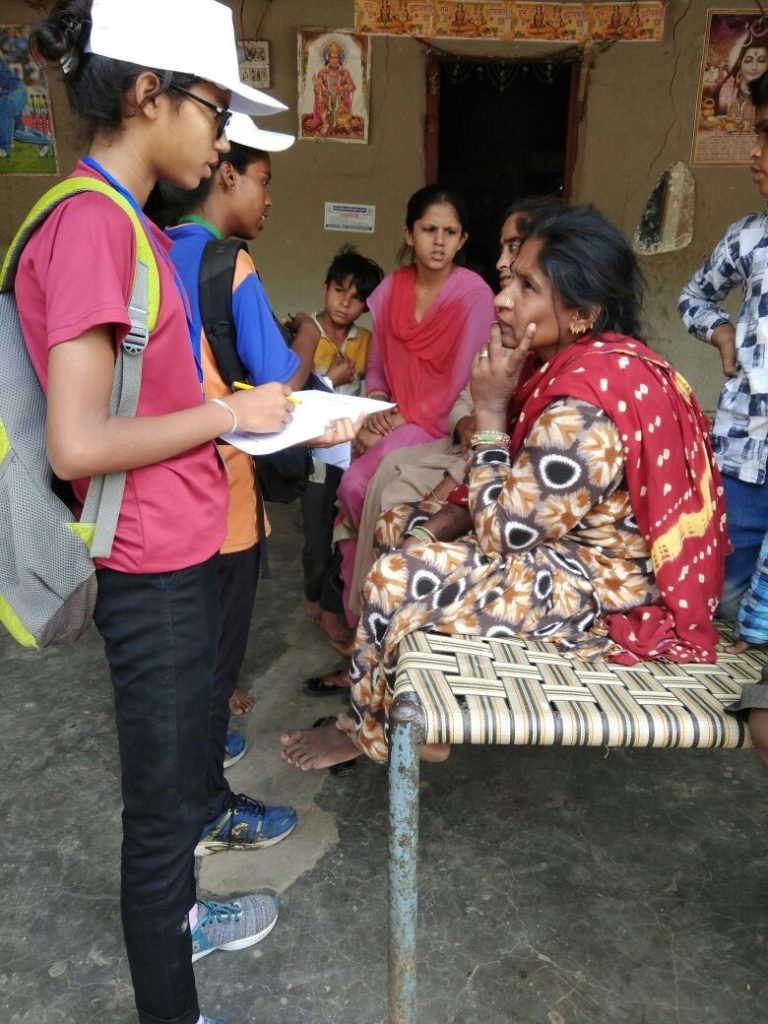
Air pollution data being collected in Delhi. Image - IITM, Pune

The survey also covers emissions due to crop burning, solid waste burning and use of diesel generators. For the transport sector, primary and secondary data will be collected about vehicle density, vehicle kilometers traveled per day, traffic composition, the age of vehicle and date of purchase, fuel used and fuel type, use of the vehicle (hours per day), number of registered vehicles and existing vehicle technology.

“Once we have ward-wise and even smaller level datasets which could be mapped in terms of defined data available for broader boundaries, we will use Geographical Information System (GIS)-based statistical model with inputs from remote sensing satellite images as well as commercially available Google Live maps to develop the inventory. It will thus reflect both primary and secondary data sets for each grid,” said Prof Gufran Beig. The emission campaign will be a useful input for the SAFAR air quality forecasting system.

The emission inventory will include pollutants including oxides of nitrogen, carbon monoxide, black carbon, organic carbon, particulate matter (2.5 micron and 10 microns), sulfur dioxide and volatile organic compounds.  Mapping will also focus on 35 specific locations where air quality monitoring stations various central and state agencies are located so that data could be correlated. The final product with 400 m x 400m high-resolution emission inventory and it is expected to be ready before the start of winter when air quality deteriorates drastically in Delhi.

Students and researchers collecting data along with IITM team are from School of Planning and Architecture, Delhi, experts from Utkal University. The Environmental Information System (ENVIS) Resource Partners hub at IITM, Pune, is a partner to this effort. (India Science Wire)

By Dinesh C Sharma

For the latest Science, Tech news and conversations, follow Research Stash on TwitterFacebook, and subscribe to our YouTube channel 
 Prof Gufran Beig

“Emission inventory is a scientific way to identify aggregated local source contribution and their region-specific spatial distribution within a confined boundary. It is a more effective tool to identify hot spots and plan control measures,” explained Prof Gufran Beig, Project Director, SAFAR at IITM, while speaking to India Science Wire. The emission inventory campaign has been mounted run by Indian Institute of Tropical Meteorology (IITM) Pune under the Ministry of Earth Sciences.

Air pollution data being collected in Delhi. IMAGE - IITM, Pune

The data being collected promises to be more accurate than what was collected in 2010 because it will include all possible sources of emissions – from crop burning to wood burning in crematoria – and also because of finer grids in which it is being collected. The city has been divided into grids measuring 400 meterX400 meter. In all, there are 12,000 such grids. Of them, data is being collected from 1000 grids.

In each of the grids, activities contributing to air pollution will be mapped. In each grid, pollution will be mapped in terms of sources such as slums, small-scale industries, road conditions, traffic congestion, vendors, population density, vehicle density, road conditions and potential of dust lifting based on paved and unpaved areas. The new sectors and factors, which are being targeted for mapping include the condition of roads, pattern of transport flow from surrounding regions, construction activity, aviation, practices of immigrant workers and changing lifestyles, cooking habit etc.

Air pollution data being collected in Delhi. Image - IITM, Pune

The survey also covers emissions due to crop burning, solid waste burning and use of diesel generators. For the transport sector, primary and secondary data will be collected about vehicle density, vehicle kilometers traveled per day, traffic composition, the age of vehicle and date of purchase, fuel used and fuel type, use of the vehicle (hours per day), number of registered vehicles and existing vehicle technology.

“Once we have ward-wise and even smaller level datasets which could be mapped in terms of defined data available for broader boundaries, we will use Geographical Information System (GIS)-based statistical model with inputs from remote sensing satellite images as well as commercially available Google Live maps to develop the inventory. It will thus reflect both primary and secondary data sets for each grid,” said Prof Gufran Beig. The emission campaign will be a useful input for the SAFAR air quality forecasting system.

The emission inventory will include pollutants including oxides of nitrogen, carbon monoxide, black carbon, organic carbon, particulate matter (2.5 micron and 10 microns), sulfur dioxide and volatile organic compounds.  Mapping will also focus on 35 specific locations where air quality monitoring stations various central and state agencies are located so that data could be correlated. The final product with 400 m x 400m high-resolution emission inventory and it is expected to be ready before the start of winter when air quality deteriorates drastically in Delhi.

Students and researchers collecting data along with IITM team are from School of Planning and Architecture, Delhi, experts from Utkal University. The Environmental Information System (ENVIS) Resource Partners hub at IITM, Pune, is a partner to this effort. (India Science Wire)

By Dinesh C Sharma

For the latest Science, Tech news and conversations, follow Research Stash on TwitterFacebook, and subscribe to our YouTube channel 

" }

New Discovery Paves Way for ‘Silicon of The Future’

Just imagine taking two extremely ultra-thin materials with different properties and placing one on top of the other, and obtaining a new material with hybrid properties. This is what an international group of researchers have done with two atomic level semiconductor materials and have got a new material whose properties are not only hybrid but also tunable

  • News
  • 2.9K
Read more
Better Lithium Ion Batteries on the Cards

Better Lithium Ion Batteries on the Cards

A team of scientists at India Institute of Technology Hyderabad has developed a set of new electrodes that promise to help produce lithium-ion batteries with higher energy densities

  • News
  • 2K
Read more
New Nanocomposite for Flexible Electronic Devices in The Offing

New Nanocomposite for Flexible Devices in The Offing

Researchers from Chennai based SRM Institute of Science and Technology have demonstrated the electronic properties of a nanocomposite made from graphene and Polyvinylidene Fluoride

  • News
  • 1.9K
Read more

Internet is huge! Help us find great content

Newsletter

Never miss a thing! Sign up for our newsletter to stay updated.

About

Research Stash is a curated collection of tools and News for S.T.E.M researchers

Have any questions or want to partner with us? Reach us at [email protected]

Navigation

Submit